Generation of plastic waste has grown rapidly since the last century. Experts say the world is on track to produce more than 1,000 metric tons of plastic waste a year by mid-century.1 Today, we make 430 million metric tons of it every year, and less than 10% actually gets recycled. That means the rest is simply straight-up waste that ends up in landfills, facing incineration, or clogging up roadsides and waterways around the world. When it comes to plastic pollution by country, the line is drawn pretty clearly. Western nations, including the U.S. and countries in the European Union, generate the most plastic waste—and therefore are ultimately responsible for the most pollution.
Here’s the breakdown of the most plastic-polluting nations out there, and how it got to be this way.
Who pollutes the most? Plastic waste by country
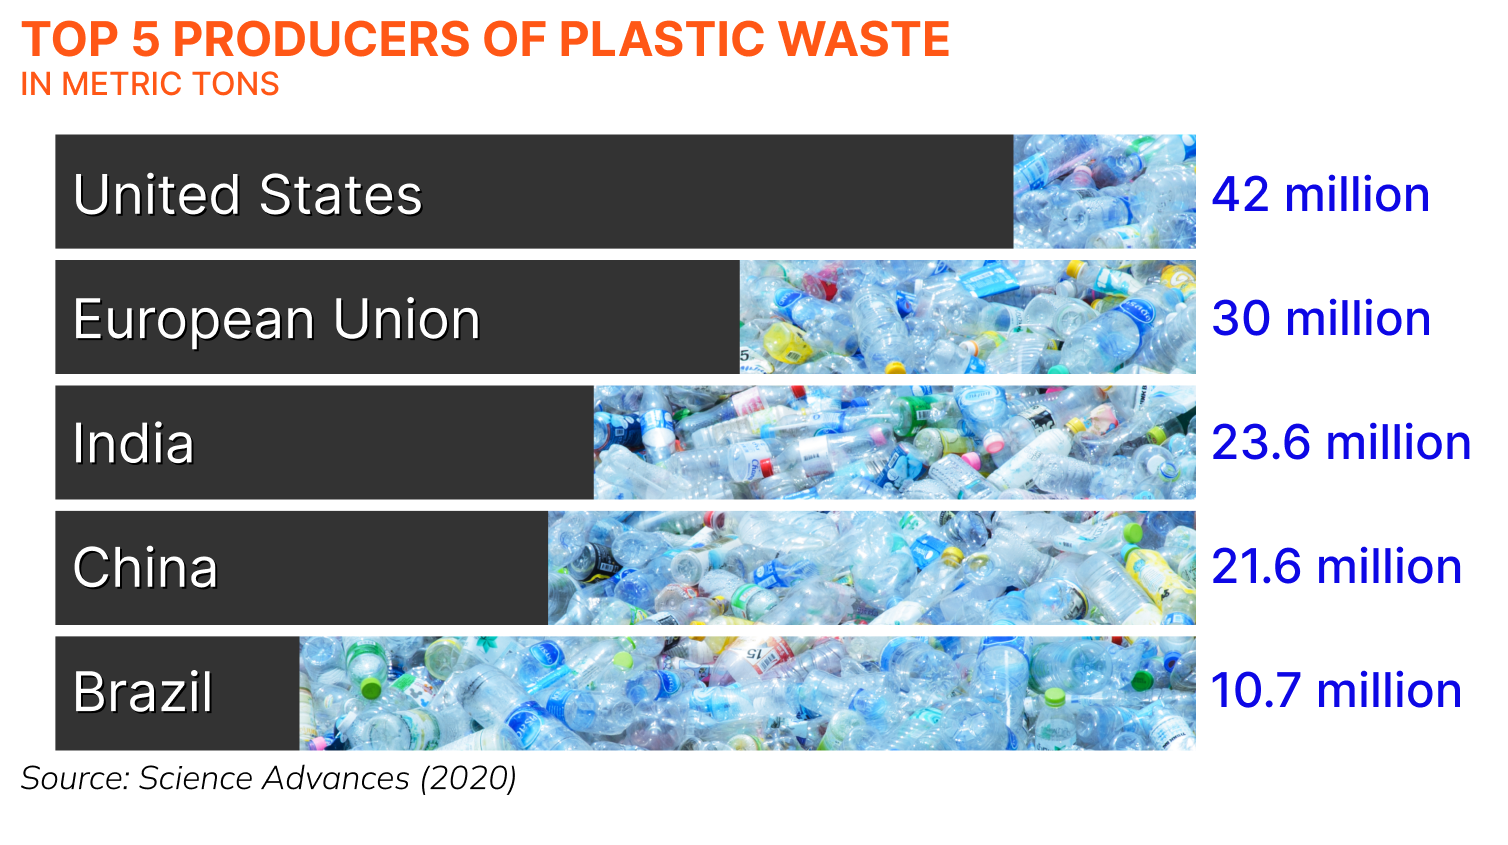
So, who leads the way in contributing to the global problem of plastic pollution? When it comes to the production of plastic waste, the United States leads the world. According to a 2020 study,2 the U.S. generates an estimated 42 million metric tons annually, or about 10% of the world’s annual plastic waste output. The European Union produces nearly 30 million metric tons each year, followed by India with 26.3 million metric tons, China with 21.6 million metric tons, and Brazil with 10.7 million metric tons.

All that would be one thing if those nations were collectively better at managing their own waste streams. According to that same study, Indonesia, India, the United States, Thailand, and China, (in that order) have the highest amounts of plastic waste that doesn’t get recycled, landfilled, or otherwise intentionally destroyed.
This stream of detritus, which is collectively called mismanaged plastic waste, winds up flowing through coastal countries and into the ocean. America’s plastic waste inputs to the coastal environment are third highest in the world, with up to 1.45 million metric tons reaching waterways every year. Combined, those five countries contribute an estimated 11 million metric tons of mismanaged waste, according to the same 2020 study.
In terms of global plastic pollution, which industries contribute the most to the issue?
Which sectors produce the most plastic?
It’s easy to see the link between which industries use the most plastic and where the most waste happens. By identifying which sectors contribute the most, we can better identify who the biggest plastic polluters by country are. According to a 2021 United Nations Environment Programme (UNEP) report,3 400-plus million metric tons of plastic products produced annually go to retailers and consumers: 36% to packaging, 15% to textiles, 16% to building and construction, 10% to consumer and institutional goods, 6.6% to transportation, 4% to electrical and electronics and 0.6% to industrial machinery.

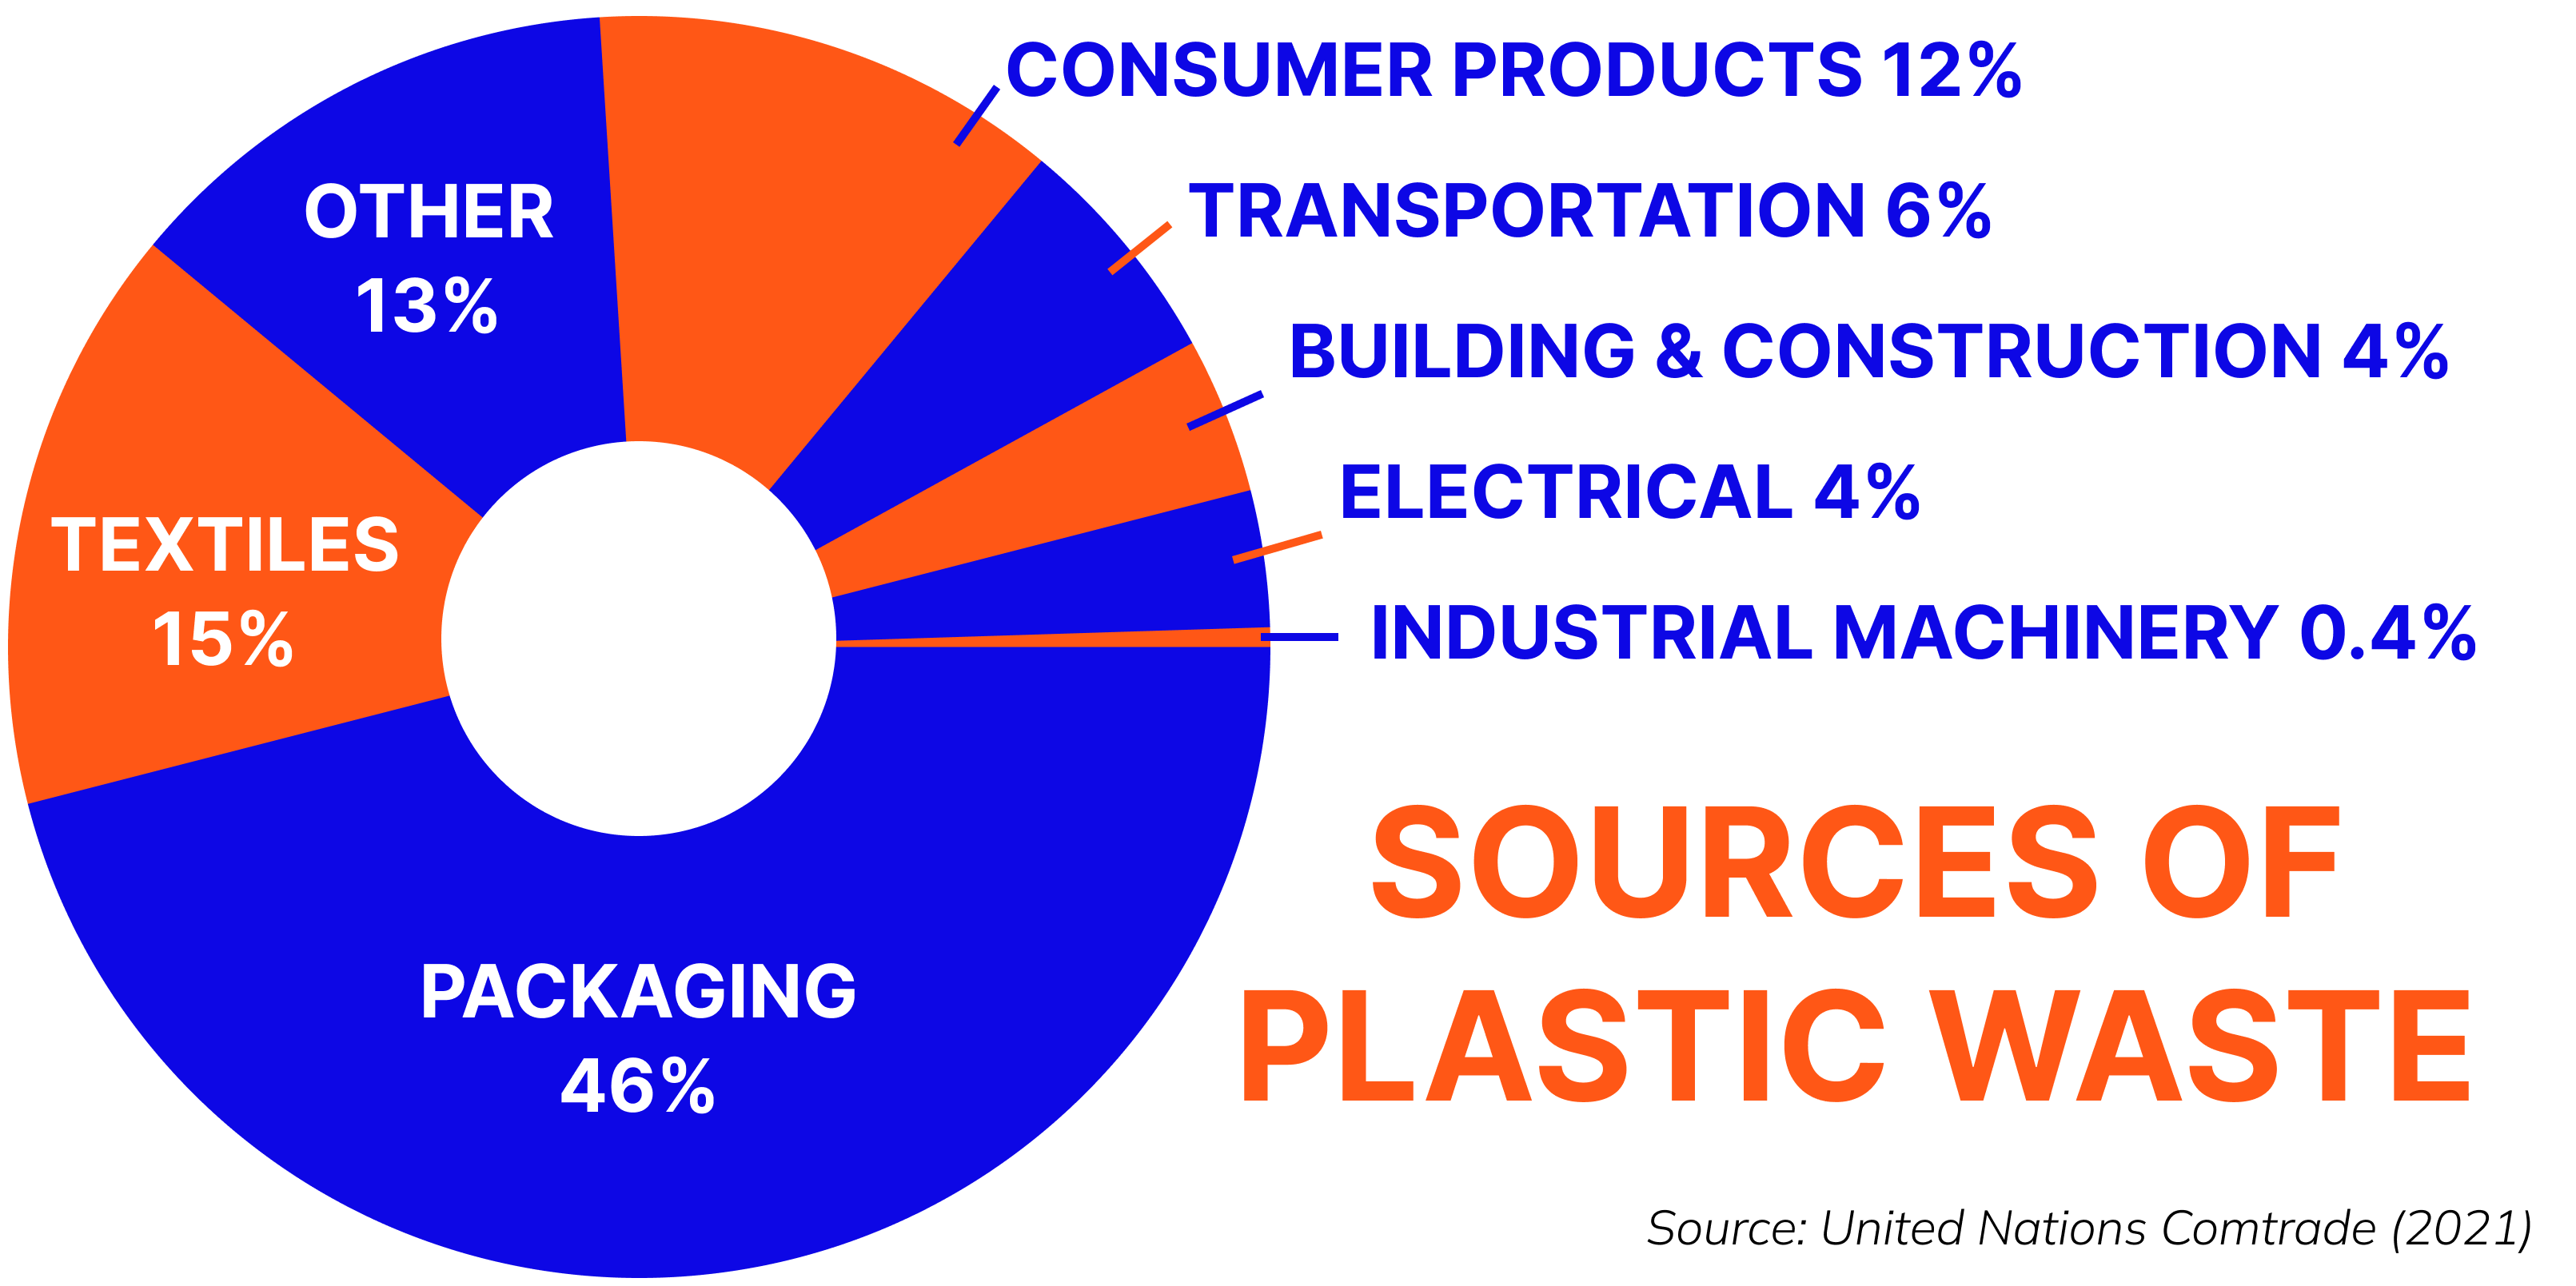
When it comes to waste, most of the trashed plastic products are also from packaging (46%), followed by textiles (15%) and consumer products (12%), according to U.N. estimates. About 13% of plastic waste generated falls in an undefined “other” category. The biggest customers for all this? You guessed it: North America, China, and Western Europe.
Crossing borders: Why is plastic traded?
The international movement of plastics began more than 50 years ago. As plastic production ramped up in the 1970s and ‘80s, the go-to method of disposing of waste by incineration became too energy-intensive to keep up with.4 That’s how a global plastic trade flow began in the 1990s. In it waste gets sent from developed countries like the United States to developing countries.
China quickly became the leading importer of the plastic waste, profiting off materials for goods production. At its peak, the nation was importing nearly half of all the plastic waste exported by other countries, hitting an annual average of 8.88 million metric tons.5 However, most of the waste was low-quality and contaminated (by food waste, for example), so China began restricting what waste it would accept. By 2017, the country enacted a new policy banning two dozen types of rubbish imports, including plastics.

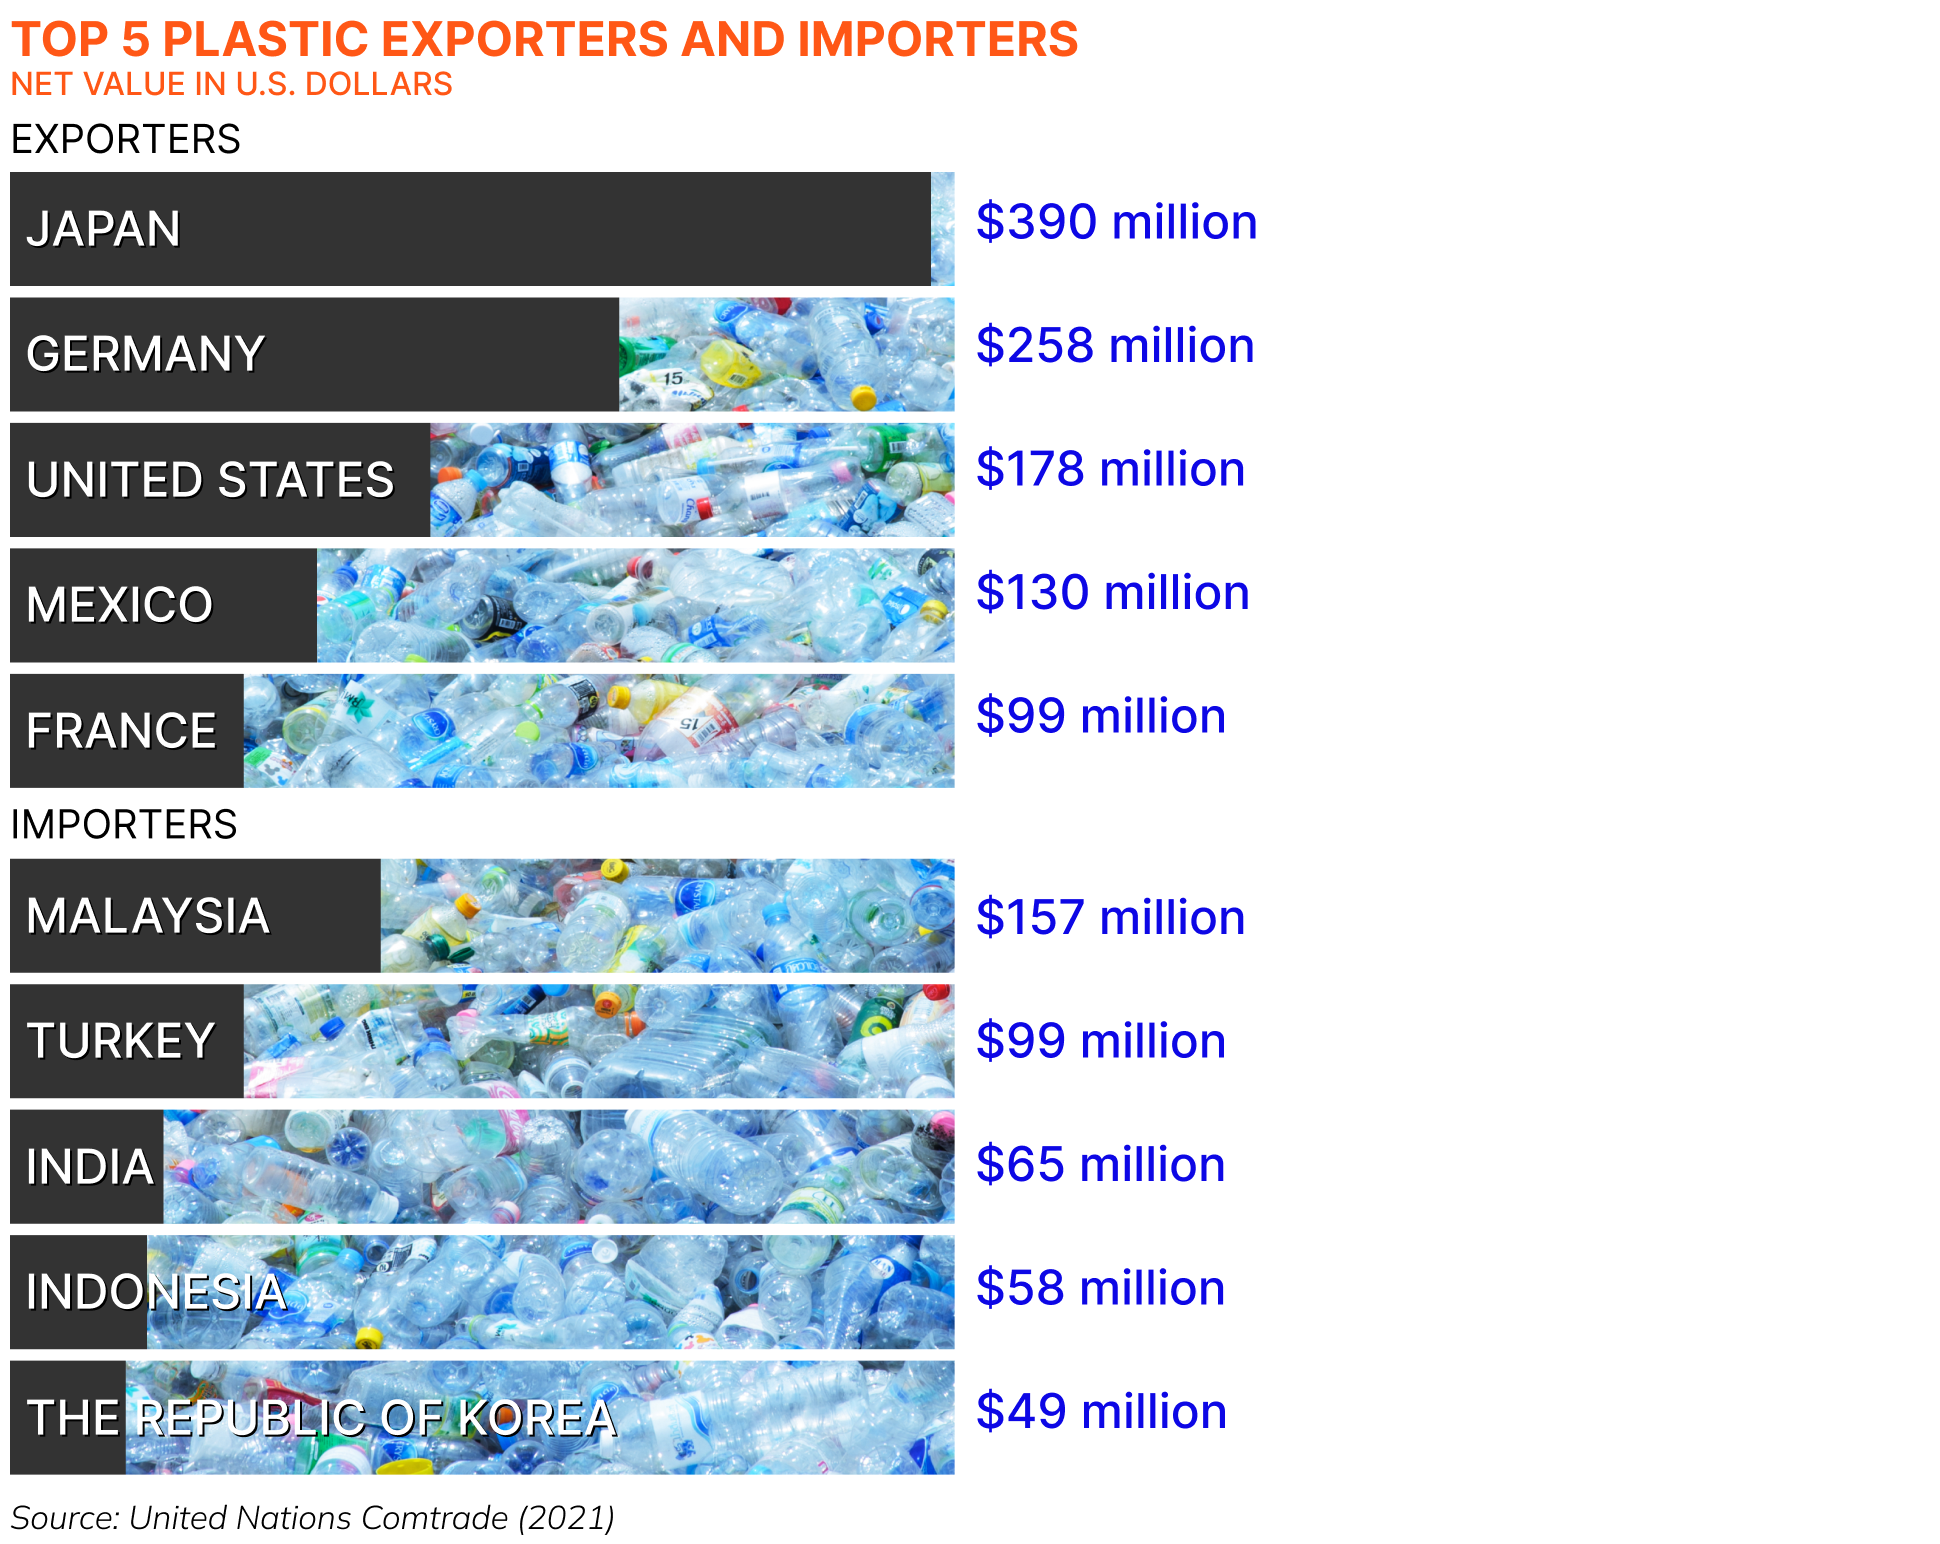
Meanwhile, that plastic waste trade surged in developing countries in Southeast Asia. This flow of waste created a major source of plastic pollution and, some argue, also contributed to a climate crisis in the region. According to the United Nations, the biggest plastic waste importing countries (in place of China) have become Malaysia, Turkey, India, Indonesia, and the Republic of Korea.6 That same U.N. report noted that, in 2018, Japan was the world’s largest exporter of plastic waste, followed by Germany, the United States, Mexico, France, and the U.K.
Where in the world is plastic pollution the biggest problem?
Plastic pollution is a global problem, but some countries and regions disproportionately feel its effects. Measuring ocean plastic pollution by country means looking at a few specific regions. Hotspots of plastic waste have been identified in marine environments across east and southeast Asia. Researchers who specialize in waste attribute this in part to the importation of unwanted plastics from other high-producing countries.7
The U.N. estimates that plastic pollution causes billions in economic damage annually worldwide, and coastal communities incur most of the costs. In 2015, the damage to marine tourism due to litter was an estimated $6.4 billion in the Asia-Pacific Economic Cooperation region. More broadly, researchers found 87 coastal countries in Europe, Asia, Africa, the Middle East, the Americas, and Oceania suffered economic losses of $6-19 billion in 2018, largely owing to the costs of cleanup and ecosystem damage.
How does plastic get into the ocean?
The majority of plastic in the ocean comes from terrestrial waste streams. According to the United Nations, about 19-23 million metric tons of plastic waste reach aquatic ecosystems from land-based sources, such as roadside litter. The fishing industry contributes about 1 million metric tons of plastic waste into the ocean each year.
Around 80% of riverine plastic trash flows around 1,000 of the world’s rivers.8 A 2019 study suggested that more than 25% of global waste has been dumped into just 14 large watersheds.9 These include the Mississippi, Nelson and Saint Lawrence watersheds in North America; the Amazon and Parana in South America; the Congo, Niger, Nile and Zambezi in Africa; the Volga and Lena in Europe; and the Amur, Yangtze and Ganges in Asia. In fact, one U.N. report found that Yangtze River is the largest contributing drainage area in Southeast Asia, contributing an annual input of about 330,000 metric tons of plastic into the East China Sea annually.10
So, who’s in the lead when it comes to ocean plastic pollution by country? Analysts generally identify the Asian Pacific region as a major contributor of marine-based plastic pollution, in part because of the global plastic waste trade.11 According to the U.N. report, the region is expected to reach 140 million metric tons of plastic waste by 2030.
Which country has the dirtiest ocean?
The ocean knows no country, nor does plastic waste. Researchers estimate that up to 12 million metric tons of plastic waste fills oceans around the world every year.12 The Philippines is cited as having the highest portion of plastic waste flowing out of its rivers, according to one 2021 study, followed by India, Malaysia, China, and Indonesia.13
The global movement of plastic waste means that even remote places like Henderson Island, a British South Pacific island, can experience the effects of plastic pollution. This World Heritage Site was estimated to be covered in about 37.7 million pieces of plastic as of 2017.
But that doesn’t mean any of those nations are singularly responsible for the global problem of plastic pollution. The global movement of plastic waste means that even remote places like Henderson Island, a British South Pacific island, can experience the effects of plastic pollution. This World Heritage Site was estimated to be covered in about 37.7 million pieces of plastic as of 2017. This area likely was impacted by debris collected in the South Pacific.
A better question for identifying sources of ocean plastic pollution by country might instead be: What is the dirtiest ocean in the world? But even this answer is hard to pinpoint. Each of the world’s five major oceans includes garbage patches of varying sizes, according to the National Oceanic and Atmospheric Administration. The “Great Pacific Garbage Patch” located between Hawaii and California is the most famous of these; it accounts for an estimated 45,000 to 129,000 tons of plastic waste at the surface.14 And that’s just the best-known and largest example. These floating collections occur when the circulation of currents—collectively referred to as a gyre—collects the trash floating on or near the surface.
Do any countries have plastic bans or restrictions?
Dozens of countries, including Panama, Tanzania and New Zealand, have bans on single-use plastic bags. In Karnataka, India, single-use plastics, from bags to spoons to cling film, are completely banned. More than two dozen countries, including China, Haiti, and France, have banned other single-use plastic products such as straws, cups, or specific materials like polystyrene. Others, such as India, Latvia and Lithuania, have instituted taxes on the producers of plastic bags or instituted mandates that place some responsibility on producers of single-use plastics.
In the United States, there are no federal regulations on single-use plastics, but some state governments, including California, Connecticut, Delaware, Hawaii, Maine, New York, Oregon and Vermont, have instituted consumer bans on plastic bags and other single-use items like plastic straws and styrofoam.
How good are various countries at recycling?
We have a better idea of the biggest plastic polluters by country– but who’s the best at recycling plastic? The success of recycling relies on the location. Slovenia recycled an estimated 58.5% of its municipal waste in 2021.15 Germany recycled 46.3% that same year. According to one report, the European Union recycles 42.4%, or 6.9 million tons, of its plastic waste.16 That would make this group of 27 countries among the best recyclers in the world.
While recycling is one way to reduce plastic waste, the process isn’t really working in the United States. The U.S. The Environmental Protection Agency touted in 2018 that America recycled about 32.1% of its waste, but a report by Greenpeace found that the U.S. only recycled about 5% of its plastic waste in 2021.17 That’s because the plastic industry itself actually fueled the push to promote recycling in the 1980s, and when demand surged, facilities weren’t really able to keep up. The inability to properly recycle plastic products that are free of “contamination” like food is part of the reason other countries like China have stopped accepting Americans plastic waste.
What are the harmful effects of plastics on the environment?
Plastics littering roadways, beaches, waterways, and communities around the world aren’t just an eyesore. They can also pose a variety of potential environmental problems.
Plastic debris in the ocean and other marine environments has been studied since at least the 1970s, when companies and countries began touting the benefits of recycling. It can harm habitats, choke wildlife (when animals ingest troublesome plastics like bags or bottle caps, for example), contaminate water sources, and fuel an industry that also contributes to the emission of harmful greenhouse gasses. Plastics on sandy beaches can accumulate and not only release harmful contaminants, but also cause the sand to warm more slowly and impact wildlife dependent on those habitats.
Are microplastics harmful to humans?
Plastic pollution on land, water, and even in the atmosphere can pose a slew of potential health risks. This is in large part due to the smaller fragments of plastics known as microplastics and nanoplastics, which occur when materials break down into smaller and smaller pieces that can easily make their way into our bodies. Plastics also contain thousands of additive chemicals used to make plastic products durable, flexible, nonstick, colorful, fire-resistant, or otherwise useful. Those additives include toxic flame retardants, pigments, PFAS, BPA, and more. Some of these compounds are carcinogenic, while others may pose a risk to endocrine systems, thyroid function, immune systems, reproductive organs, cardiovascular health, fetal and child development, and more.
- From Pollution to Solution: A global assessment of marine litter and plastic pollution, United Nations Environment Programme, Oct. 2021. ↩︎
- The United States’ contribution of plastic waste to land and ocean, Science, Oct. 2020. ↩︎
- Drowning in plastics – marine litter and plastic waste vital graphics, United Nations Environment Programme, Oct. 2021 ↩︎
- Plastic waste and microplastic issues in Southeast Asia, Frontiers in Environmental Science, Apr. 2023. ↩︎
- China’s plastic import ban increases prospects of environmental impact mitigation of plastic waste trade flow worldwide, Nature Communications, Jan. 2021. ↩︎
- Drowning in plastics – marine litter and plastic waste vital graphics, United Nations Environment Programme, Oct. 2021. ↩︎
- It’s the product not the polymer: Rethinking plastic pollution, WIREs Water, Oct. 2020. ↩︎
- More than 1000 rivers account for 80% of global riverine plastic emissions into the ocean, Science Advances, Apr. 2021. ↩︎
- Future scenarios of global plastic waste generation and disposal, Palgrave Communications, Jan. 2019. ↩︎
- State of plastics waste in Asia and the Pacific–Issues, challenges and circular economic opportunities, United Nations Centre for Regional Development, Dec. 2020. ↩︎
- A global perspective on microplastics, JGR Oceans, Jan. 2020. ↩︎
- Plastic waste and microplastic issues in Southeast Asia, Frontiers in Environmental Science, Apr. 2023. ↩︎
- More than 1000 rivers account for 80% of global riverine plastic emissions into the ocean, Science Advances, Apr. 2021. ↩︎
- A global perspective on microplastics, JGR Oceans, Jan. 2020. ↩︎
- Circular economy–waste and materials, Organisation for Economic Cooperation and Development, Aug. 2023. ↩︎
- Efficiency of consumer behaviour and digital ecosystem in the generation of the plastic waste toward the circular economy, Journal of Environmental Management, Jan. 2023. ↩︎
- Circular Claims Fall Flat Again, Greenpeace, Oct. 2022. ↩︎

